Optimizing Postgres Queries for Faster Kiosk Data Delivery
Tuesday, July 23, 2019
Click here to go to all posts. Also published on the Intersection blog
Tuning a single query can dramatically improve performance options
An important aspect of a smart city kiosk is the idea that data and functionality are ready and waiting for a user at all times. As I mentioned in a previous post, Improving perceived interface responsiveness on public kiosks, the responsiveness of our kiosks is compared to analog signage, paper printouts, and folding pamphlets.
Beyond some of the previous areas of focus, such as advanced caching and optimal rendering, we also load a significant amount of data ahead of time, often on an interval basis. One particular area that’s been a challenge for us is making sure that kiosks have the transit alert information for all routes in the entire transit system.
This is best demonstrated by example. Take a look at this interface for the bus alerts within the Chicago Transit Authority (CTA):
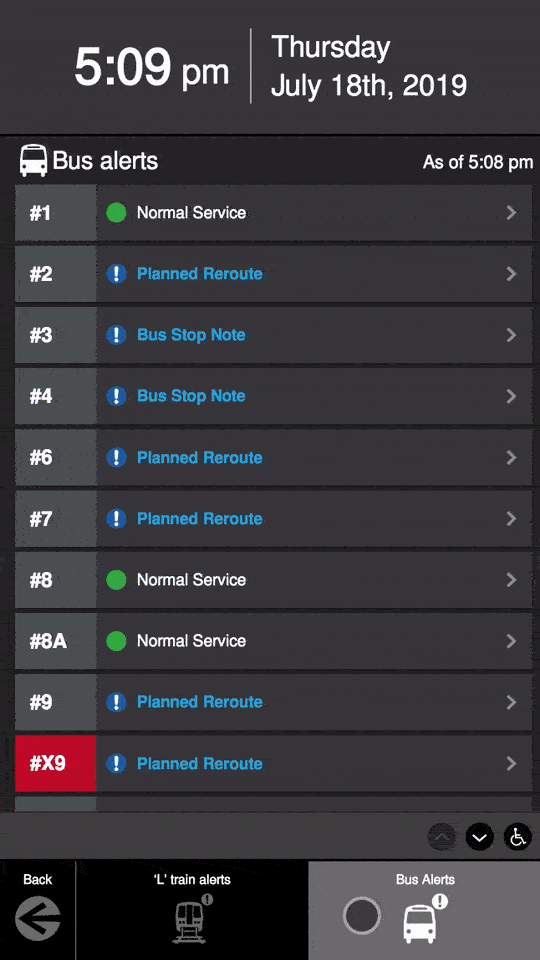
You’ll notice that the detailed alert information for each route is instantly loaded when the user taps on a specific route. This isn’t by chance: we fetch all alerts for each route on a regular basis.
But that’s easier said than done. There are some pretty significant performance constraints related to this lookup!
Context: information targeting
Let’s start with a bit of context before digging into the technical challenge. Our smart cities platform, known as IxNConnect, is our way of delivering the information and features to displays out in the real world. There are two parts to this:
1) What information/features to show, and
2) Where to show them
In terms of what we show, it can include subway arrivals, public service announcements (PSAs), transit alerts, maps, and more.
When it comes to answering the “where” question, things get interesting. One of the value propositions of IxNConnect is the concept of “targeting.”
As part of bringing on a client, such as a transit agency, we import a data model that represents how their built environment is structured. In the case of a transit agency, this is the hierarchy of modes, routes, and stops that represents the transit network. In the case of a community, this may be the campus, buildings, and floors.
Targeting, coupled with our content management features, means that our clients can granularly determine what information/features show up where on their displays. For example:
- Show a safety PSA video on all displays
- Show the Blue Line service change on displays along the Blue Line route
- Show an elevator construction notice on displays at a particular stop
In order to match how users interact with physical space and make our targeting capabilities as intuitive as possible, we take this information a step further. When targeting, information/features will trickle down to more granular levels.
For example, a PSA targeted to an entire transit route will show at all displays on that route, even if they were not explicitly targeted. Similarly, an emergency alert targeted to several routes will show up on all displays along each of those routes.
Unfortunately, this means a bit of processing in order to figure out the full list of transit alerts that can impact a particular route, and even more processing to get that information for all routes.
Again, using the example from the IxNTouch kiosk GIF, let’s look at one of the alerts that shows up for the #6 bus line:
In this case, this particular alert is targeted at several lines (routes). In other cases, an alert will be targeted at a stop, which means it needs to be related back up to routes.
While our model of the built environment varies by vertical (transit, community, district, etc.), the hierarchy of targeting for transit can be generalized to this:
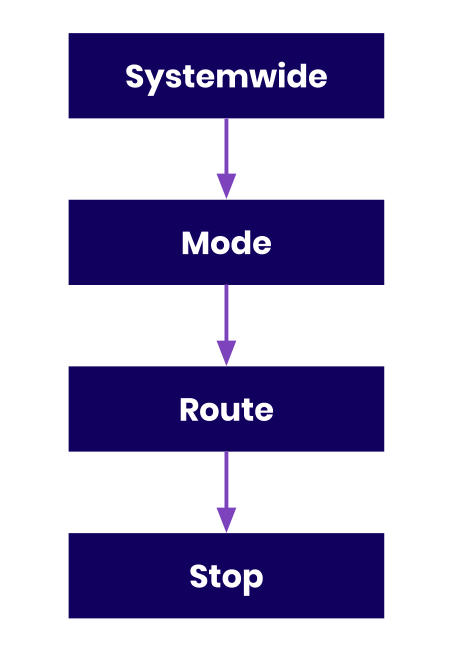
We take the vast majority of our transit hierarchy from the transit agency’s own GTFS data!
So, our problem statement is: given a transit hierarchy and a set of alerts targeted at any level in that hierarchy, how can we efficiently build a set of “alerts by route” with our Postgres queries?
Step 0: Understand the current Postgres queries
For a while, we’ve been using a query like this to build our table of alerts by route on the fly:
SELECT DISTINCT tr.id AS route\_id, array\_agg(DISTINCT a.id) AS alert\_list
FROM alert\_data a, transit\_stops ts
  LEFT JOIN transit\_route\_stops trs ON trs.stop\_id = ts.id
  LEFT JOIN transit\_routes tr ON tr.id = trs.route\_id
  LEFT JOIN transit\_modes tm ON tm.id = tr.transit\_mode\_id
  WHERE (
    EXISTS (
      SELECT 1
      FROM object\_targeting otd
      WHERE otd.targeted\_object\_type::text = 'ALERTS'::text AND
      otd.targeted\_object\_id = a.id AND (
        otd.attribute\_type::text = 'ROUTE'::text AND otd.attribute\_id = tr.id OR otd.attribute\_type::text = 'STOP'::text AND otd.attribute\_id = ts.id OR otd.attribute\_type::text = 'MODE'::text AND otd.attribute\_id = tm.id
      )
    )
  ) AND a.organization\_id = tm.organization\_id AND a.active = true
GROUP BY tr.id;
While this query has been working, it’s been pretty slow at times. Let’s break out our trusty EXPLAIN ANALYZE to understand it’s performance.
Here’s the summary:
Unique (cost=1164359.95..1164365.25 rows=707 width=36) (actual time=44010.657..44010.940 rows=349 loops=1)
Ouch.
In particular, two parts of this stood out as particularly bad:
1) Work to join these different tables
Hash Semi Join (cost=84,497.64..861,539.66 rows=563,830 width=8) (actual time=13,390.682..42,954.627 rows=37,769 loops=3)Hash Cond: (a.id = otd.targeted\_object\_id)
Join Filter: ((((otd.attribute\_type)::text = 'ROUTE'::text) AND (otd.attribute\_id = tr.id)) OR (((otd.attribute\_type)::text = 'STOP'::text) AND (otd.attribute\_id = ts.id)) OR (((otd.attribute\_type)::text = 'MODE'::text) AND (otd.attribute\_id = tm.id)))
Rows Removed by Join Filter: 1258331
2) Work to filter down to alerts
Seq Scan on object\_targeting otd (cost=0.00..44,915.94 rows=2,258,254 width=14) (actual time=0.014..5,287.794 rows=2,258,256 loops=3)Filter: ((targeted\_object\_type)::text = 'ALERTS'::text)
Rows Removed by Filter: 237
Rough. Let’s see what we can do to optimize things!
Step 1: Break down the query
With this big query, what we’re trying to do is:
- Get all active alerts
- Get all routes with their relevant stops, modes, etc.
- Get the alerts that apply to a given route by, A) the route directly, or B) the stops, modes, etc. that are related to that route
With that in mind, let’s break out the parts of this query into bite-sized chunks.
First, here’s a query to retrieve a table with the fully expanded transit information:
SELECT DISTINCT \*
FROM transit\_stops ts
  LEFT JOIN transit\_route\_stops trs ON trs.stop\_id = ts.id
  LEFT JOIN transit\_routes tr ON tr.id = trs.route\_id
  LEFT JOIN transit\_modes tm ON tm.id = tr.transit\_mode\_id
Next, a query to retrieve all active alerts:
SELECT \* FROM alert\_data a
WHERE a.active = true;
Finally, a query to retrieve alerts with the “tag” of the route, stop, mode, etc.:
SELECT otd.attribute\_id as attribute\_id, otd.attribute\_type as attribute\_type, otd.targeted\_object\_id as alert\_id, a.organization\_id as organization\_id
    FROM alert\_data a, object\_targeting otd
    WHERE a.active = true AND a.id = otd.targeted\_object\_id;
Now the question is, how do we piece these together in an efficient way?
Step 2: Improve the parts of the query
One of the biggest issues with the original query is that it doesn’t follow a clear logical flow. It’s hard to see where information is being joined/added/removed/etc. So, we take advantage of Common Table Expressions (CTEs) for two reasons:
- To clean up the logic flow, which makes it easier to read
- To improve performance by temporarily persisting this information for the duration of the query
Quick note: When trying to improve the performance of your own queries, make sure to try both subqueries and CTEs, as depending on the use case, one may be more CPU or memory efficient!
With CTEs, we can make two of the queries into temporary tables for cleaner use, like this:
WITH transitinfo AS (
  SELECT DISTINCT trs.route\_id AS route\_id, tr.route\_code AS route\_code, ts.id AS stop\_id, ts.stop\_code AS stop\_code, tm.id AS mode\_id, tm.organization\_id AS organization\_id
  FROM transit\_stops ts
    LEFT JOIN transit\_route\_stops trs ON trs.stop\_id = ts.id
    LEFT JOIN transit\_routes tr ON tr.id = trs.route\_id
    LEFT JOIN transit\_modes tm ON tm.id = tr.transit\_mode\_id
  ),
  activealerts AS (
    SELECT otd.attribute\_id as attribute\_id, otd.attribute\_type as attribute\_type, otd.targeted\_object\_id as alert\_id, a.organization\_id as organization\_id
    FROM alert\_data a, object\_targeting otd
    WHERE a.active = true AND a.id = otd.targeted\_object\_id
  )
SELECT \* FROM transitinfo;
This query saves the alerts, the parts of the hierarchy they’re targeted at, and the transit hierarchy information as temporary tables and then uses one of those temporary tables for a SELECT as though it were a permanent table.
At this point, we can make a new functioning query:
WITH transitinfo AS (
  SELECT DISTINCT trs.route\_id AS route\_id, tr.route\_code AS route\_code, ts.id AS stop\_id, ts.stop\_code AS stop\_code, tm.id AS mode\_id, tm.organization\_id AS organization\_id
  FROM transit\_stops ts
    LEFT JOIN transit\_route\_stops trs ON trs.stop\_id = ts.id
    LEFT JOIN transit\_routes tr ON tr.id = trs.route\_id
    LEFT JOIN transit\_modes tm ON tm.id = tr.transit\_mode\_id
  ),
  activealerts AS (
    SELECT otd.attribute\_id as attribute\_id, otd.attribute\_type as attribute\_type, otd.targeted\_object\_id as alert\_id, a.organization\_id as organization\_id
    FROM alert\_data a, object\_targeting otd
    WHERE a.active = true AND a.id = otd.targeted\_object\_id
  )
SELECT transitinfo.route\_id as route\_id, array\_agg(DISTINCT activealerts.alert\_id) as alert\_list
FROM transitinfo JOIN activealerts
ON activealerts.attribute\_type = 'ROUTE' AND activealerts.attribute\_id = transitinfo.route\_id OR activealerts.attribute\_type = 'STOP' AND activealerts.attribute\_id = transitinfo.stop\_id OR activealerts.attribute\_type = 'MODE' AND activealerts.attribute\_id = transitinfo.mode\_id AND activealerts.organization\_id = transitinfo.organization\_id
GROUP BY route\_id;
Here is the summary of the results of running EXPLAIN ANALYZE with this new query:
GroupAggregate (cost=74815.63..74852.75 rows=200 width=40) (actual time=14979.139..15041.552 rows=350 loops=1)
Better! But it looks like we’re still filtering out a ton of data, probably due to some of the huge redundant information we have. Fortunately, we have a tool that we’ve already been using that can help here: the array_agg function.
Step 3: Put it all together
The array_agg function — one of the built-in aggregate functions in Postgres — puts results into an array type, which is something that Postgres does support. We had been using this for the return value, but we can use it again to improve performance.
With a little work, we can change the duplicative rows into multiple values in the same row. Here’s the query:
WITH transitinfo AS (
    SELECT DISTINCT trs.route\_id AS route\_id,
      array\_agg(DISTINCT ts.id) stop\_id\_list,
      array\_agg(DISTINCT tm.id) AS mode\_id\_list,
      array\_agg(DISTINCT tm.organization\_id) AS organization\_id\_list
    FROM transit\_stops ts
      LEFT JOIN transit\_route\_stops trs ON trs.stop\_id = ts.id
      LEFT JOIN transit\_routes tr ON tr.id = trs.route\_id
      LEFT JOIN transit\_modes tm ON tm.id = tr.transit\_mode\_id
      GROUP BY route\_id
  ),
  activealerts AS (
    SELECT otd.attribute\_id as attribute\_id,
      otd.attribute\_type as attribute\_type,
      otd.targeted\_object\_id as alert\_id,
      a.organization\_id as organization\_id
    FROM alert\_data a, object\_targeting otd
    WHERE a.active = true AND a.id = otd.targeted\_object\_id
  )
SELECT transitinfo.route\_id as route\_id,
  array\_agg(DISTINCT activealerts.alert\_id) as alert\_list
FROM transitinfo JOIN activealerts
ON (
  activealerts.attribute\_type = 'ROUTE' AND activealerts.attribute\_id = transitinfo.route\_id
  OR activealerts.attribute\_type = 'STOP' AND activealerts.attribute\_id = ANY(transitinfo.stop\_id\_list)
  OR activealerts.attribute\_type = 'MODE' AND activealerts.attribute\_id = ANY(transitinfo.mode\_id\_list)
) AND activealerts.organization\_id = ANY(transitinfo.organization\_id\_list)
GROUP BY route\_id;
You can see that we’ve replaced the individual matches with the ANY selector. Here is the EXPLAIN ANALYZE result of this new query:
GroupAggregate (cost=20263.11..20267.71 rows=200 width=40) (actual time=5655.332..5656.372 rows=349 loops=1)
The final tally
Let’s compare our EXPLAIN ANALYZE numbers:
Before:
(cost=1164359.95..1164365.25 rows=707 width=36) (actual time=44010.657..44010.940 rows=349 loops=1)
After:
(cost=20263.11..20267.71 rows=200 width=40) (actual time=513.863..514.905 rows=349 loops=1)
So, a ~5x improvement in query cost and an order of magnitude (or more!) improvement in actual time!
Let’s take a look at our Postgres DB CPU utilization before and after this query update was deployed to production:
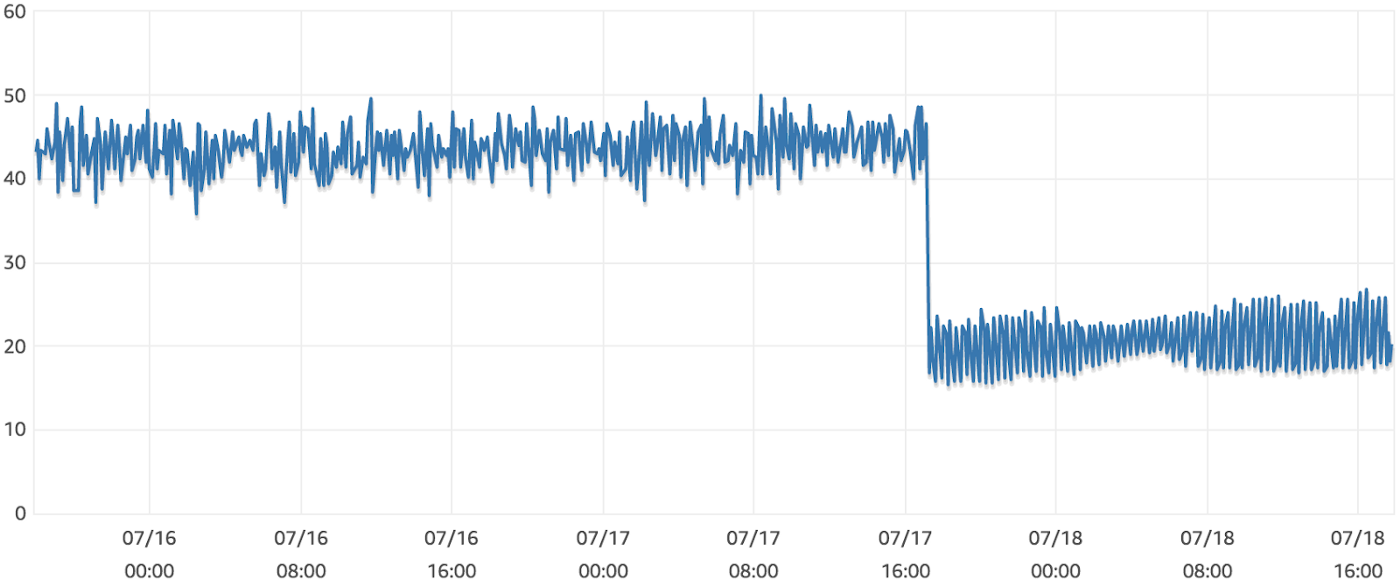
Not bad at all! We still have room to improve, but the investment in optimizing a single query went a long way.
Tying this back to the user experience
While this write-up has been focused on optimizing a database query, it is ultimately focused on delivering an extremely performant user experience for folks using a smart city kiosk. Improving the performance of our back-end services lowers the time and cost of delivering information frequently to our displays, which in turn creates an even greater sense of immediacy to our IxNTouch and IxNSight products.
One of the biggest differences between hand-held devices and products that integrate with the built environment is the solutions that they replace and/or augment. For smart city kiosks, users expect glanceable, low-latency interactions, and making sure that our back-end can support various permutations of information delivery is essential to a successful platform.